
Widget: Table
The Table widget shows a saved report as a table, with the same groupings, metrics, filters and sorting as in the report builder.
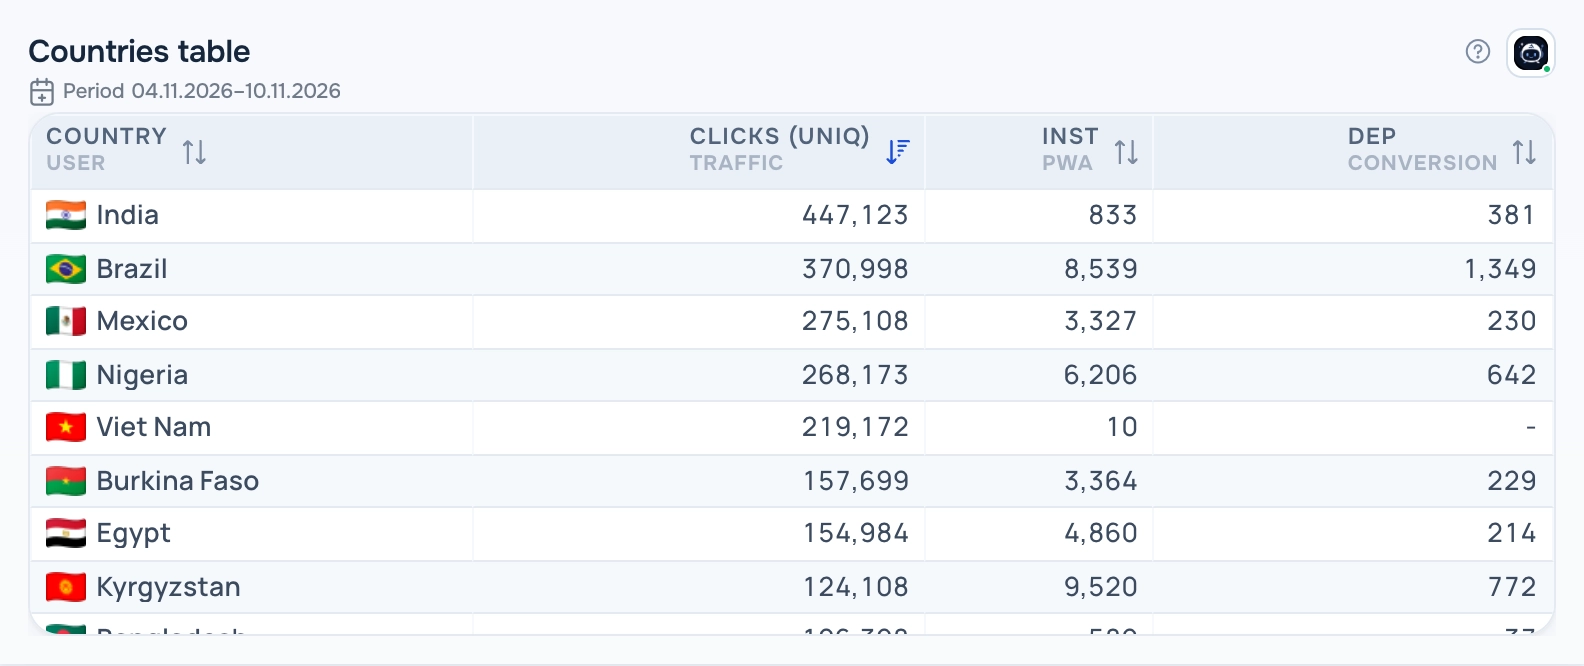
Table widget
What the report needs
Any saved report.
Views
The widget has several views. Switch the view in the widget header while the dashboard is in edit mode; the choice is saved with the dashboard.
Table
The report table as in the report builder, including period comparison if the report has it.
Mini bars
A compact table with a bar under each value: the bar is the share of the column maximum.
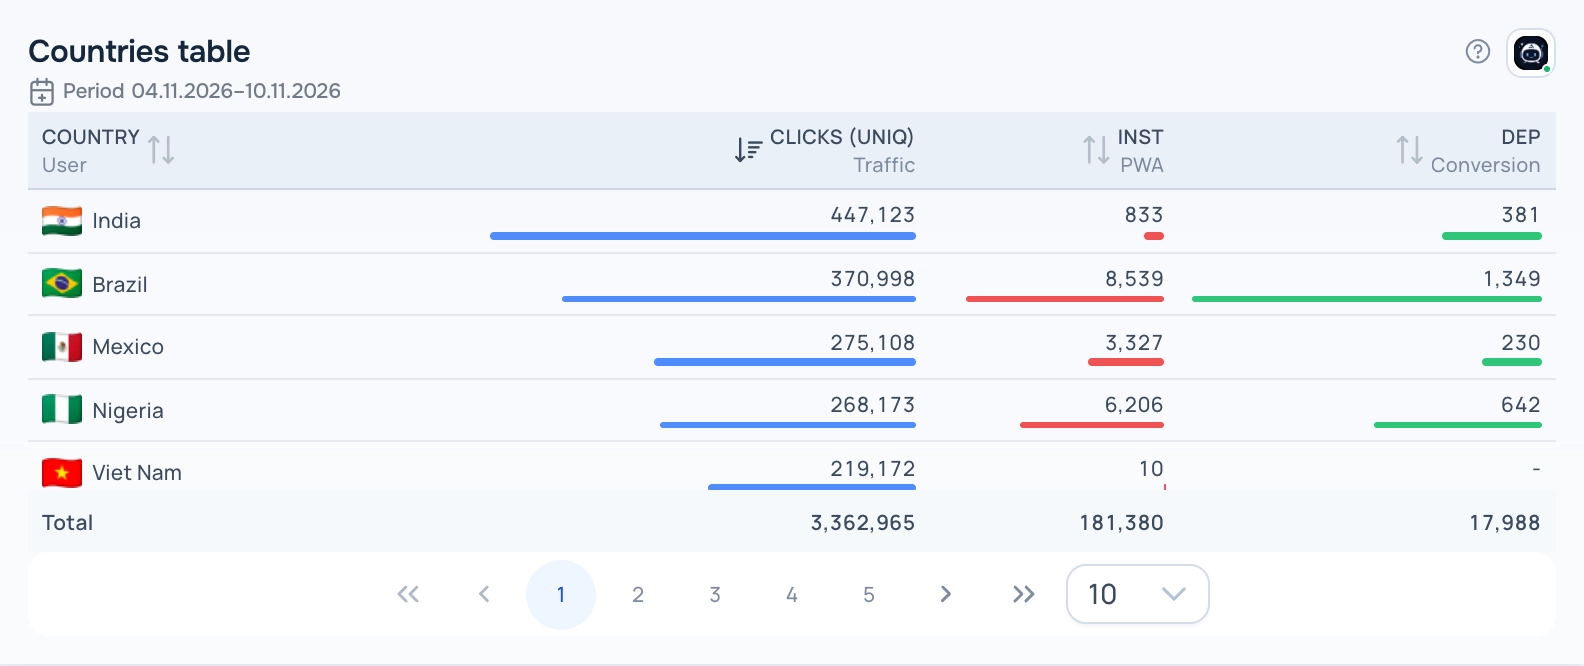
Table — Mini bars view
Heat
A compact table where the cell background depends on the value, plus a trend line of the first metric for the last days.
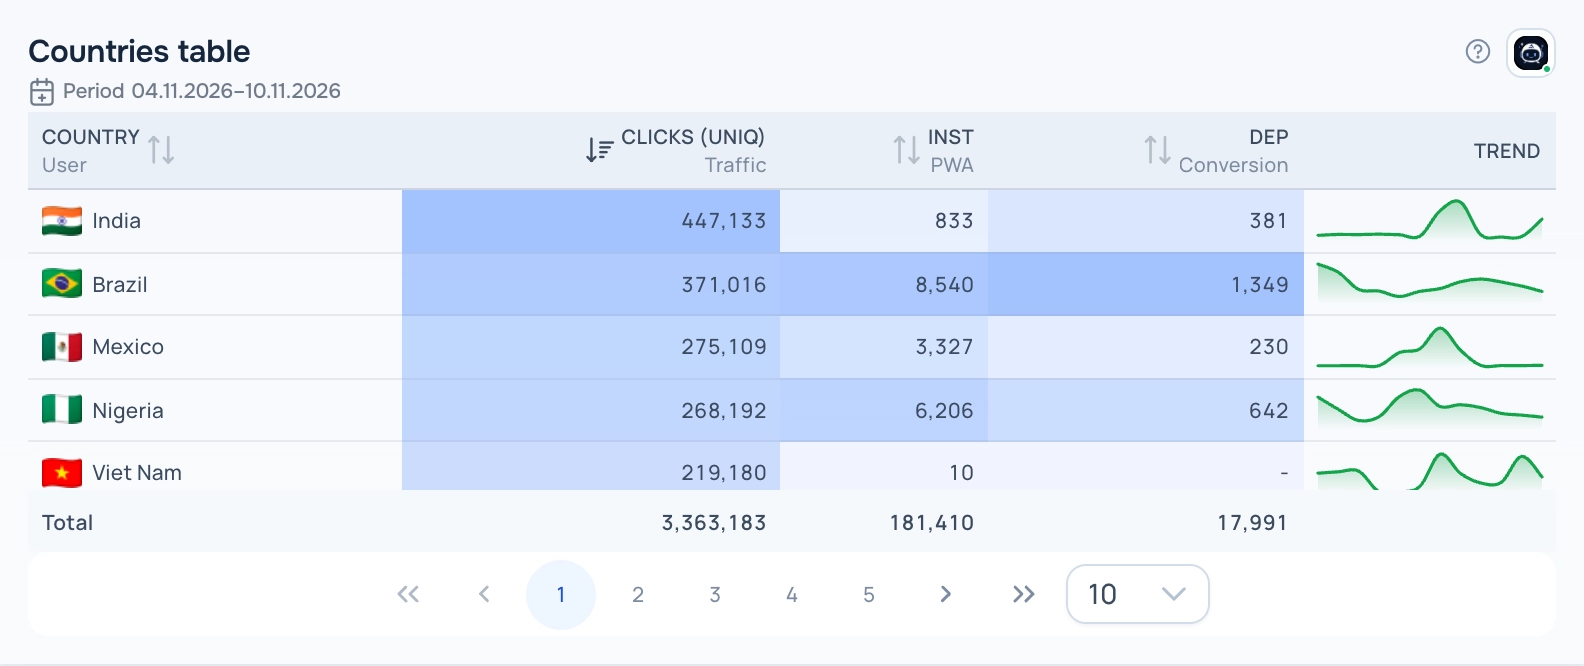
Table — Heat view
How to add the widget
- Open Tracker → Dashboard, open the dashboard list and click the pencil icon next to your dashboard to enter edit mode.
- Click Add Widget and choose Table in Display type.
- Pick a report in Select saved report. The list shows only reports that fit this display type. If it is empty, create a report in Tracker → Reports first.
- Set the optional title, width and height and the rows limit, then click Save.
- Click Save on the dashboard toolbar to keep the changes.
Settings
- Rows limit — rows per page.
Period
The widget shows data for the period saved in its report; the caption under the title shows the dates. When you change the dates in the dashboard date selector, all widgets switch to the dashboard period.
Tips
- Click a column header to sort. Use the paginator under the table to change the page and the number of rows.
- The trend column in the Heat view appears when the report has one non-time grouping.
The ? button in the widget header opens this help article. The Adset AI button next to it opens the assistant with the widget context and ready-made questions about its data.