
Widget: Heatmap
The Heatmap widget shows one metric across two groupings as a colored grid, for example clicks by day and hour.
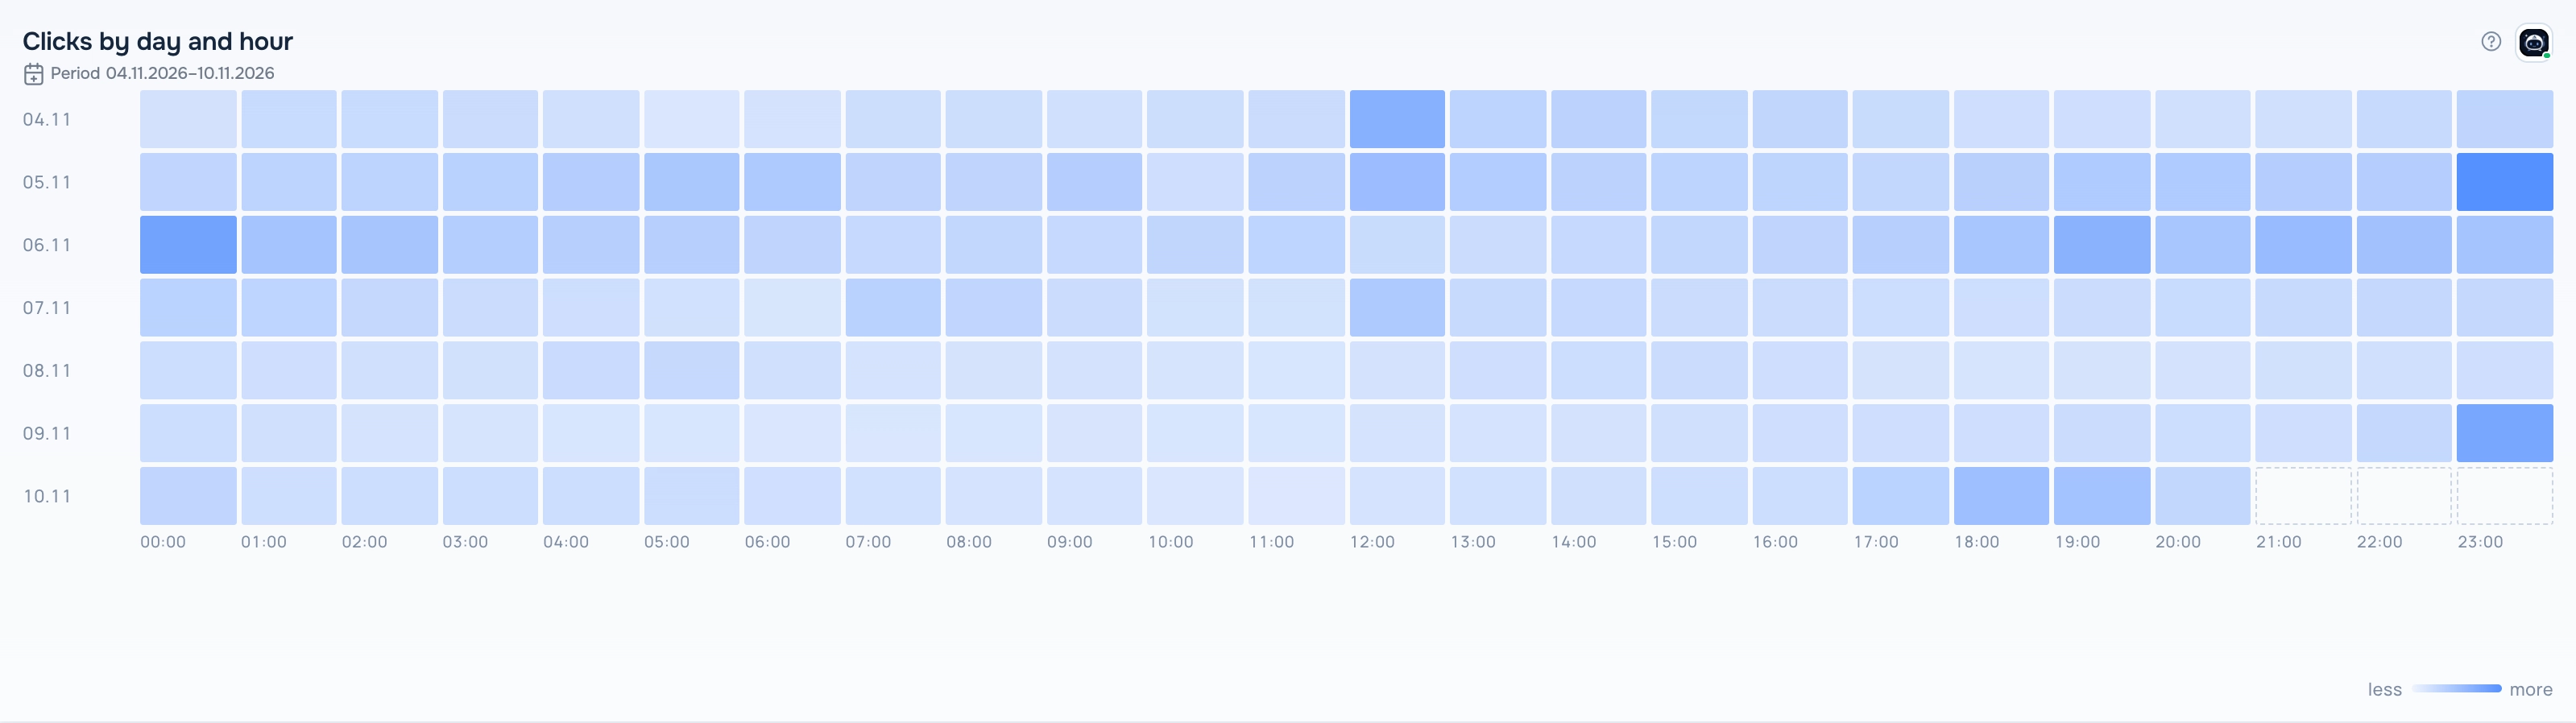
Heatmap widget
What the report needs
A saved report with exactly two groupings and at least one metric. The first grouping gives the rows, the second one gives the columns.
Views
The widget has several views. Switch the view in the widget header while the dashboard is in edit mode; the choice is saved with the dashboard.
Grid
Cells colored by value: the more intense the color, the higher the value.
With totals
The same grid with totals for rows and columns.
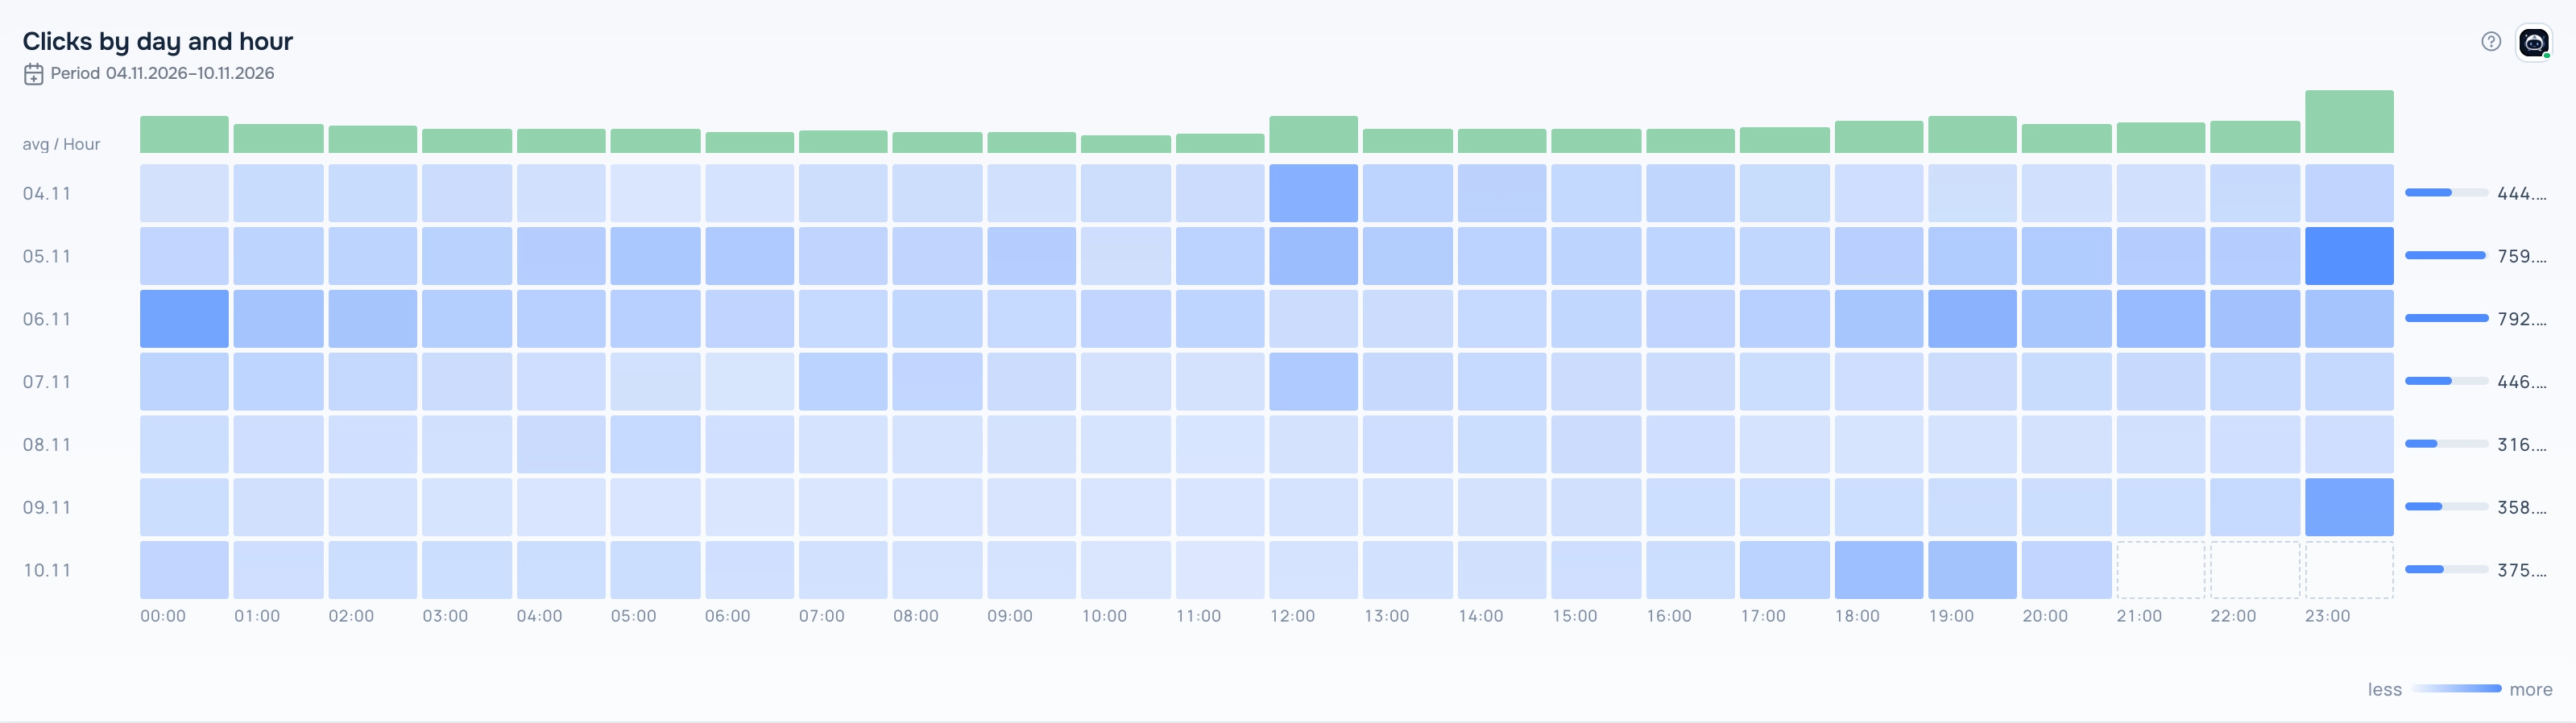
Heatmap — With totals view
Vs average
Cells colored by the deviation from the average: above average in one color, below in another.
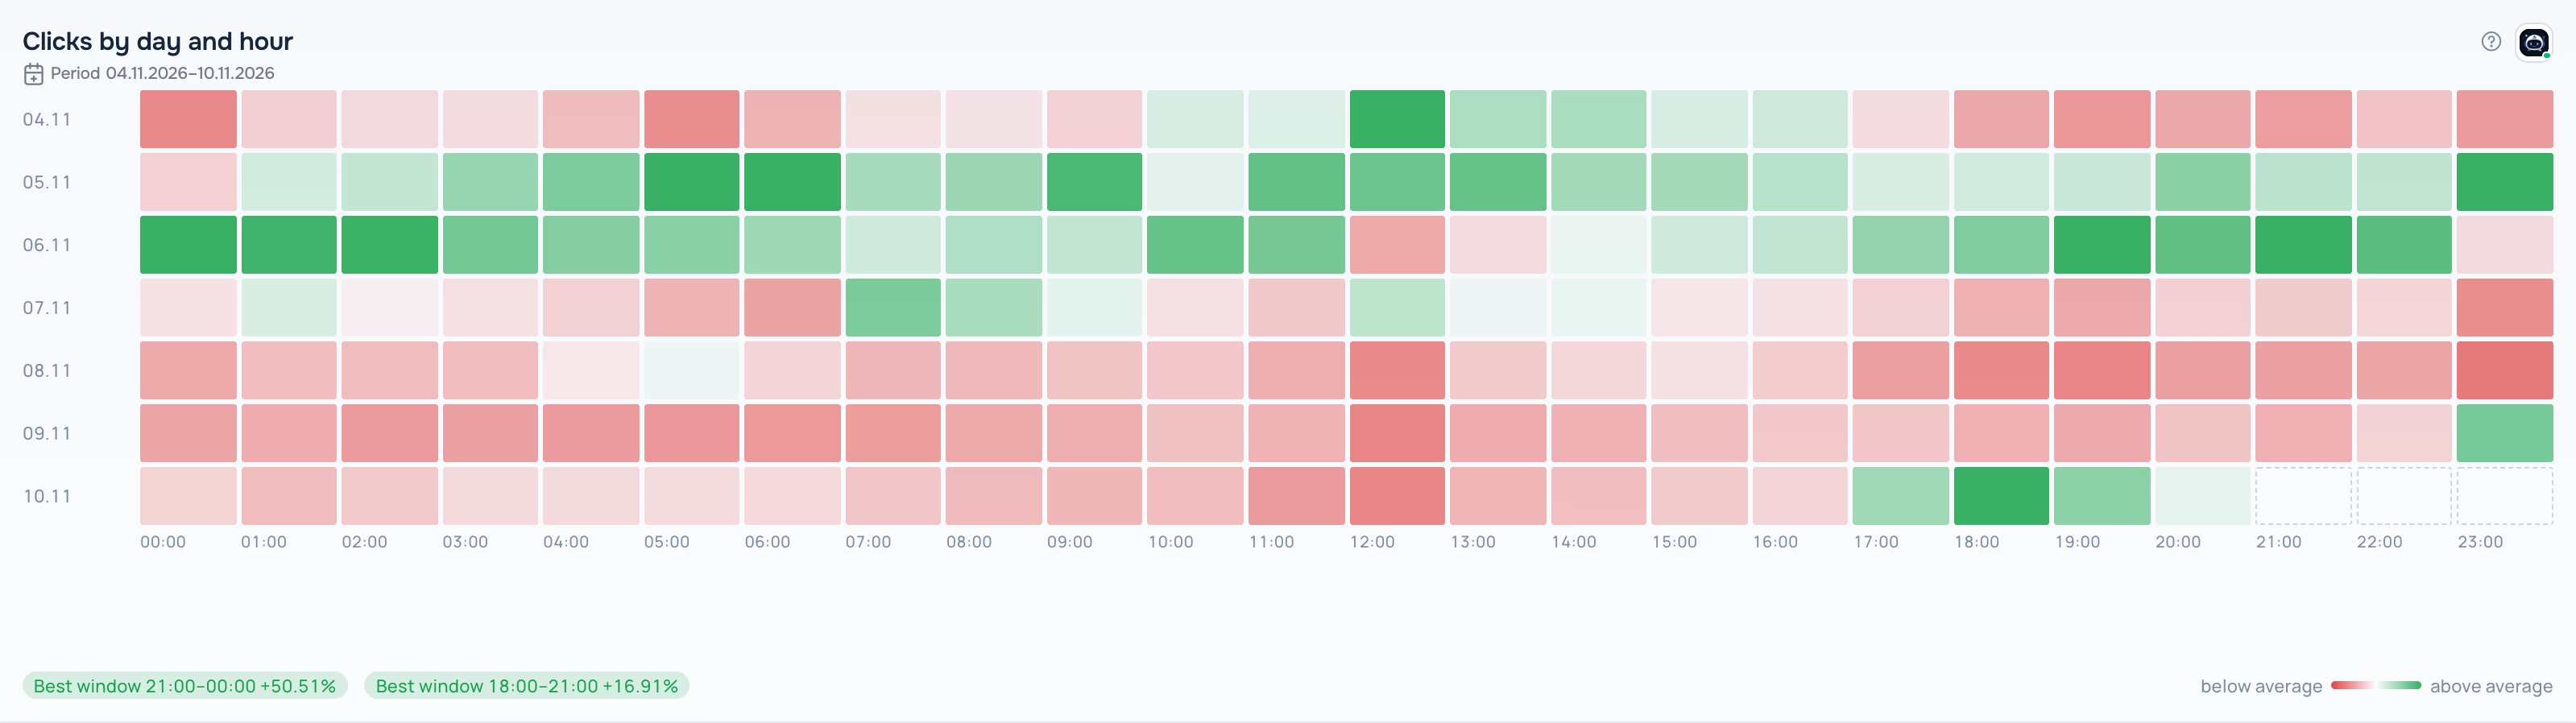
Heatmap — Vs average view
How to add the widget
- Open Tracker → Dashboard, open the dashboard list and click the pencil icon next to your dashboard to enter edit mode.
- Click Add Widget and choose Heatmap in Display type.
- Pick a report in Select saved report. The list shows only reports that fit this display type. If it is empty, create a report in Tracker → Reports first.
- Set the optional title, width and height and the main metric, then click Save.
- Click Save on the dashboard toolbar to keep the changes.
Settings
- Main metric — the metric shown in the cells.
Period
The widget shows data for the period saved in its report; the caption under the title shows the dates. When you change the dates in the dashboard date selector, all widgets switch to the dashboard period.
Tips
- Day + hour shows at what time of day the traffic or conversions come.
- When there are many columns, the widget shows the top ones and says how many are hidden.
The ? button in the widget header opens this help article. The Adset AI button next to it opens the assistant with the widget context and ready-made questions about its data.