
Dashboard Builder
The Dashboard Builder is a tool for creating personalized monitoring panels with widgets based on saved reports. You can create your own dashboards, customize the layout and sizes of the widgets, and set a default dashboard for quick access to important data.
Interface Structure
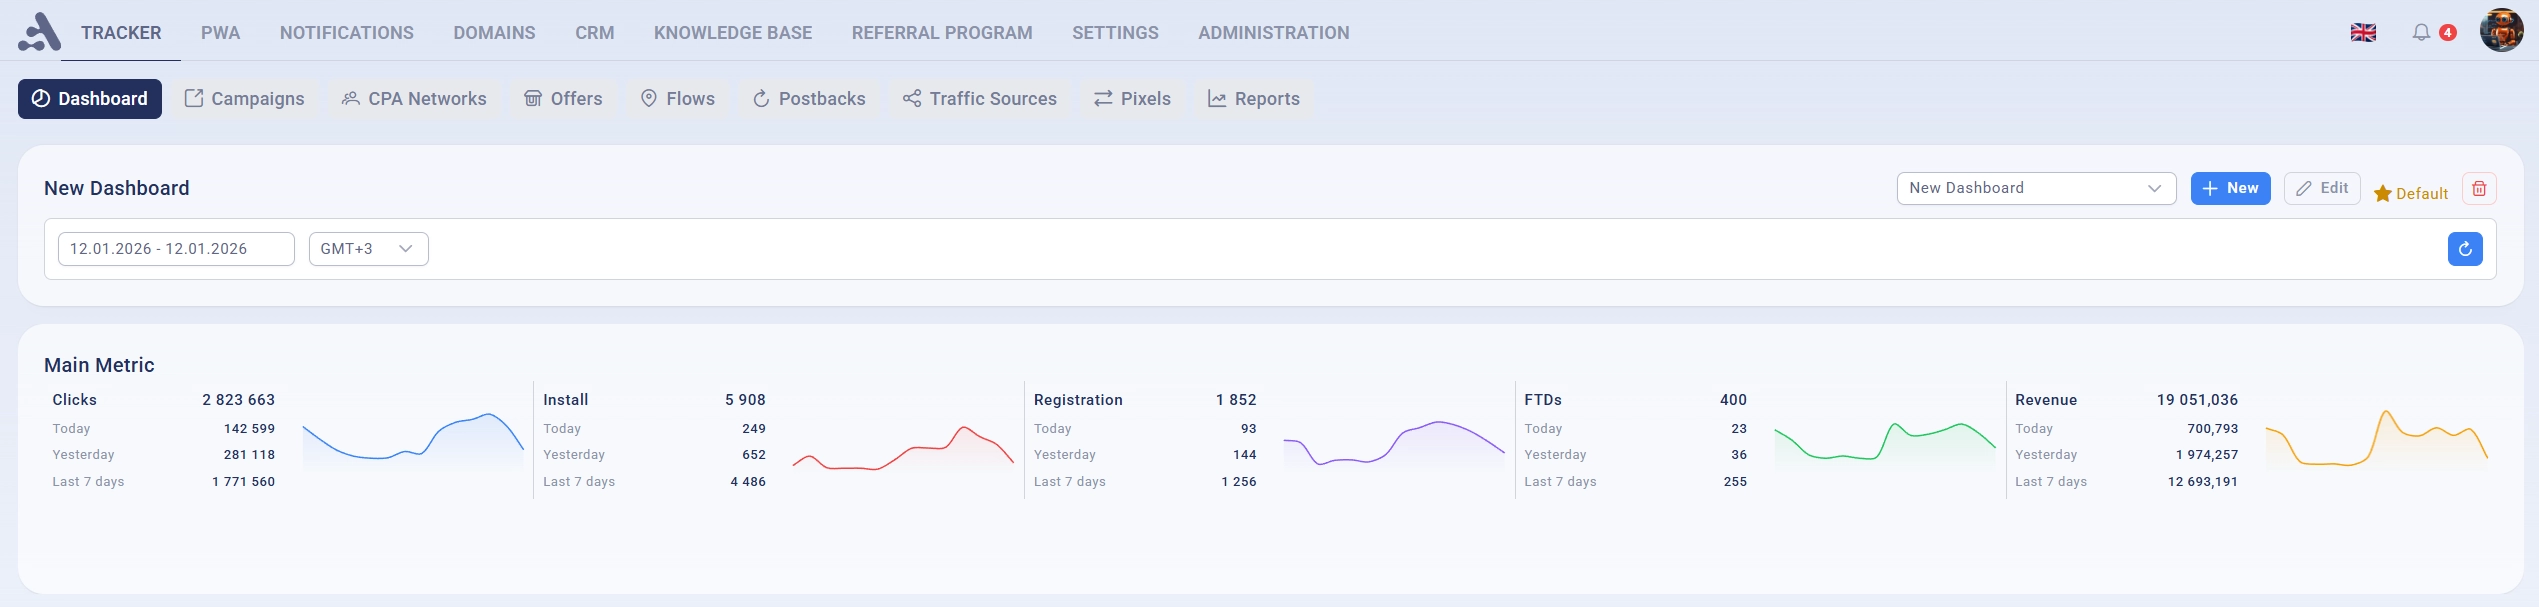
The dashboard interface consists of:
Control Panel — dashboard selection, create and edit buttons
Time Panel — setting the period and time zone for data
Widgets Area — grid with widgets or system dashboard
Section 1: System Dashboard
1.1 What is a System Dashboard?
Upon first entering the Tracker section, you will see the System Dashboard — a pre-installed set of widgets available to all users.
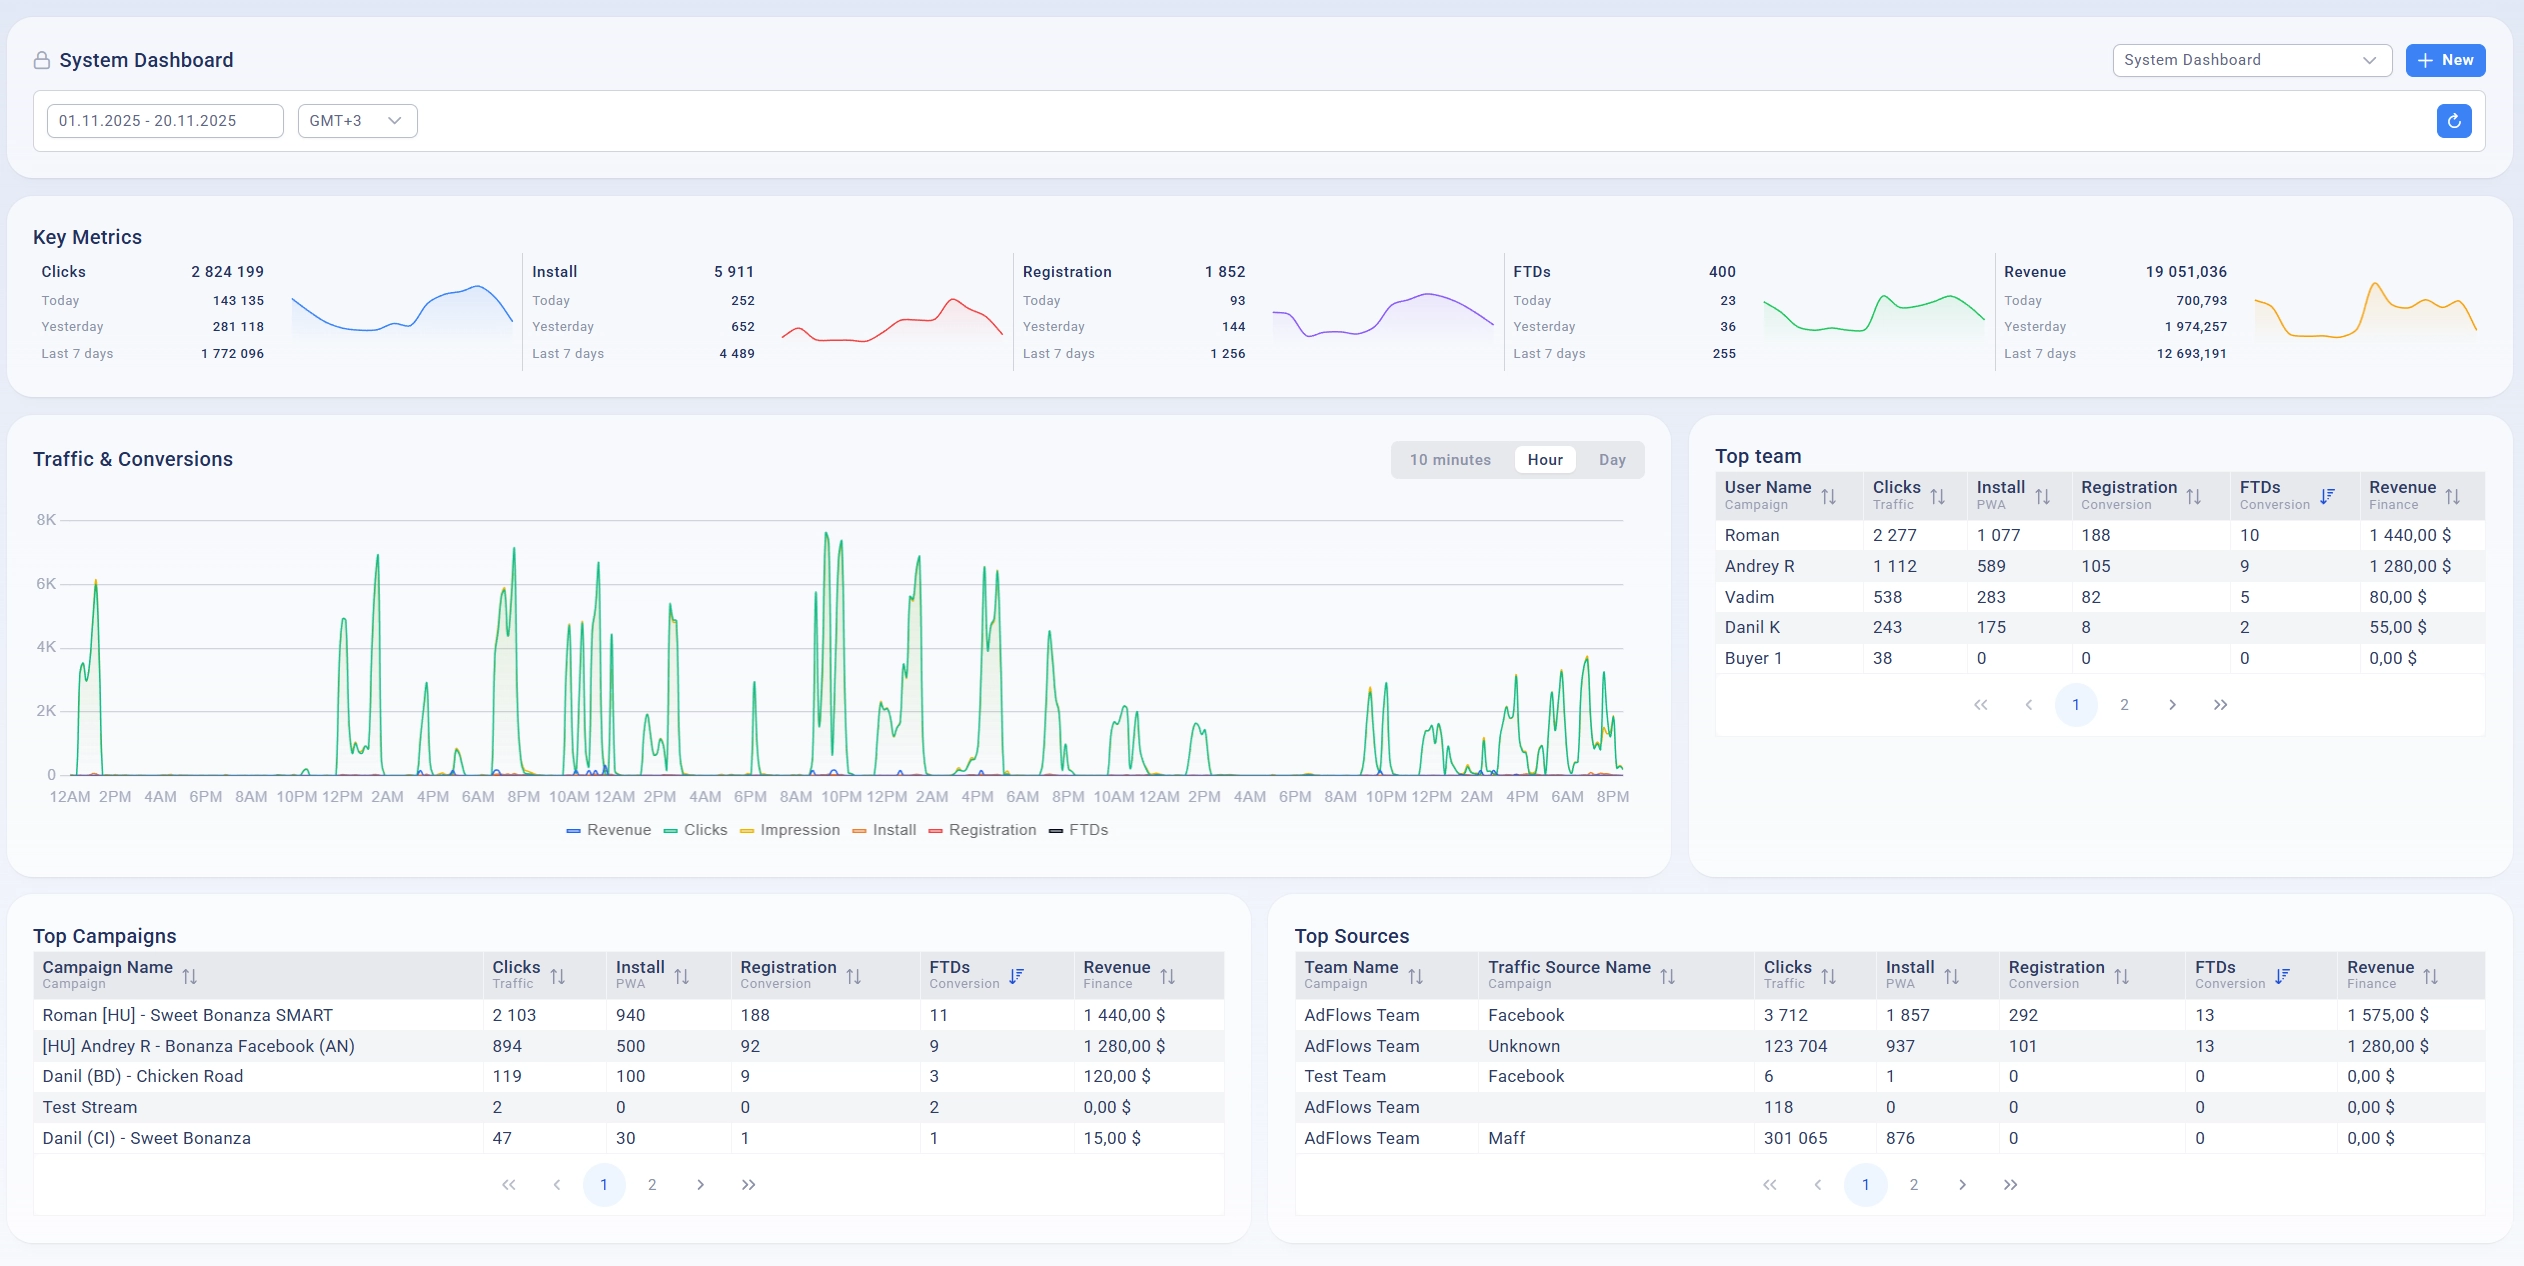
The System Dashboard contains:
Metric Cards — overall statistics (Clicks, Installs, Hold, Accept, Revenue)
Traffic and Conversion Chart — line chart with time granularity
Top Users — table with the best results by users
Top Campaigns — table with the best campaigns
Top Sources — table with the best sources
1.2 Features of the System Dashboard

🔒 Cannot be edited — Edit and Delete buttons are hidden
📊 Always available — displayed first in the list of dashboards
🔄 Can be replaced — create your own dashboard and set it as default
💡 Tip: The System Dashboard is a great starting point. Explore its widgets to understand what data you need, then create your own dashboard.
Section 2: Managing Dashboards
2.1 Selecting a Dashboard

Use the dropdown list to switch between:
System Dashboard — system dashboard (always first)
Your Dashboards — dashboards created by you
2.2 Creating a New Dashboard
Click the "New" button (blue button with a + icon)
The system will create an empty dashboard and automatically switch to edit mode
Enter the dashboard name in the title field

2.3 Edit Mode
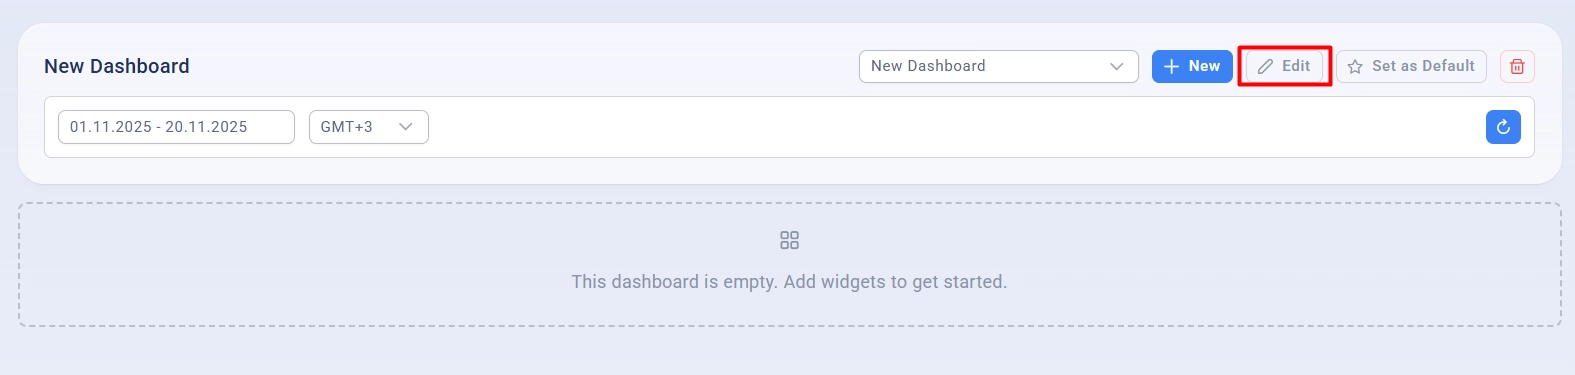
To enter edit mode, click the "Edit" button.
In edit mode, the following options are available:
✏️ Change the dashboard name
➕ Add widgets
🔄 Drag and drop widgets
↔️ Resize widgets
🗑️ Delete widgets
To save changes, click the "Save" button (green).
⚠️ Important: Unsaved changes will be lost when switching to another dashboard.
2.4 Setting a Default Dashboard
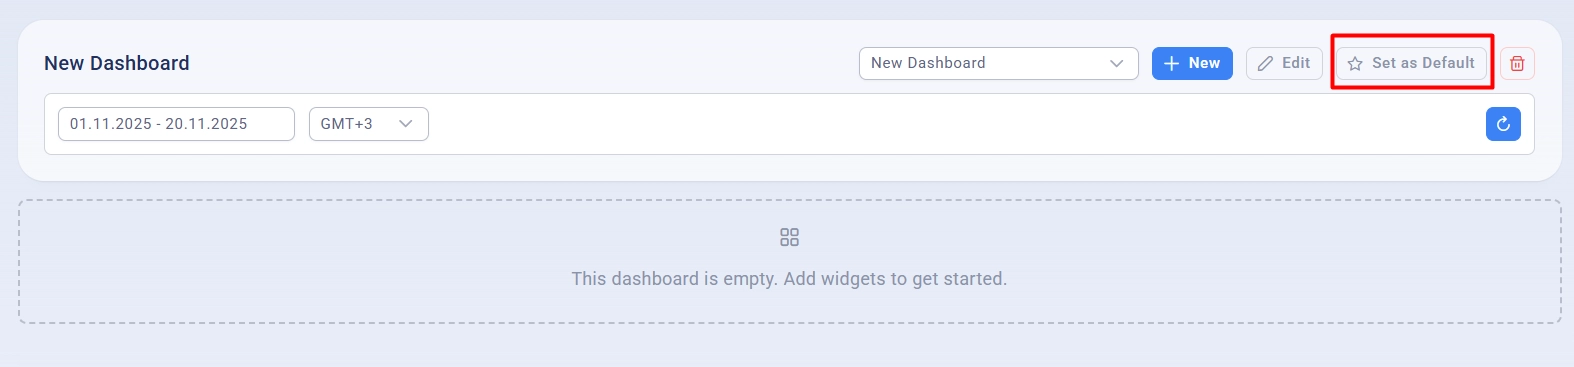
Select the desired dashboard
Click the "Set as Default" button (star icon)
A "Default" label will appear next to the name
The default dashboard:
Opens automatically when entering the Tracker section
Replaces the system dashboard as the start page
Marked with a yellow star
2.5 Deleting a Dashboard
Select the dashboard to delete
Click the trash can button (red)
Confirm deletion in the dialog box
⚠️ Attention: Deleting a dashboard is irreversible. All widgets will be removed.
Section 3: Working with Widgets
3.1 Adding a Widget
Enter edit mode (Edit button)
Click the "Add Widget" button (green with a + icon)
A widget setup dialog will open
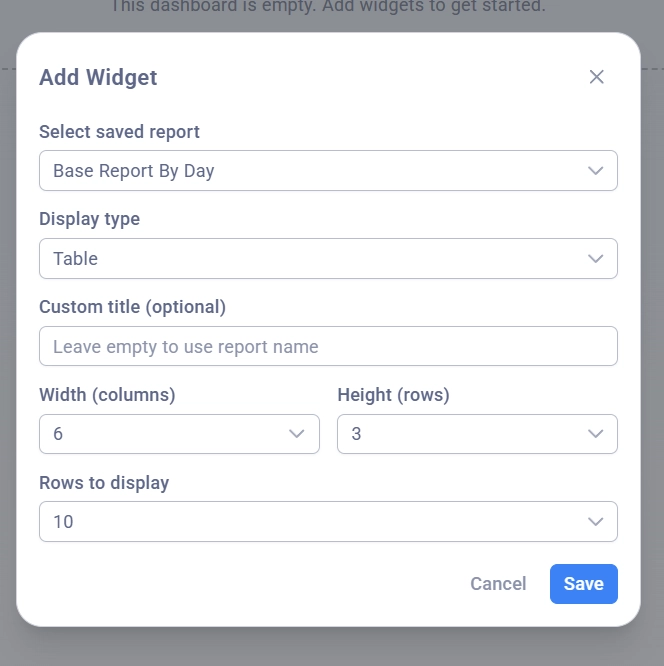
Widget Parameters:
Parameter | Description |
|---|---|
Select saved report | Select a saved report — the data source for the widget |
Display type | Display type: Table, Line Chart, Metrics Cards |
Custom title | Custom title (optional) |
Width | Width in columns (1-12) |
Height | Height in rows (1-8) |
Rows to display | Number of rows for the table |
Time granularity | Time granularity for charts |
3.2 Widget Types
Table
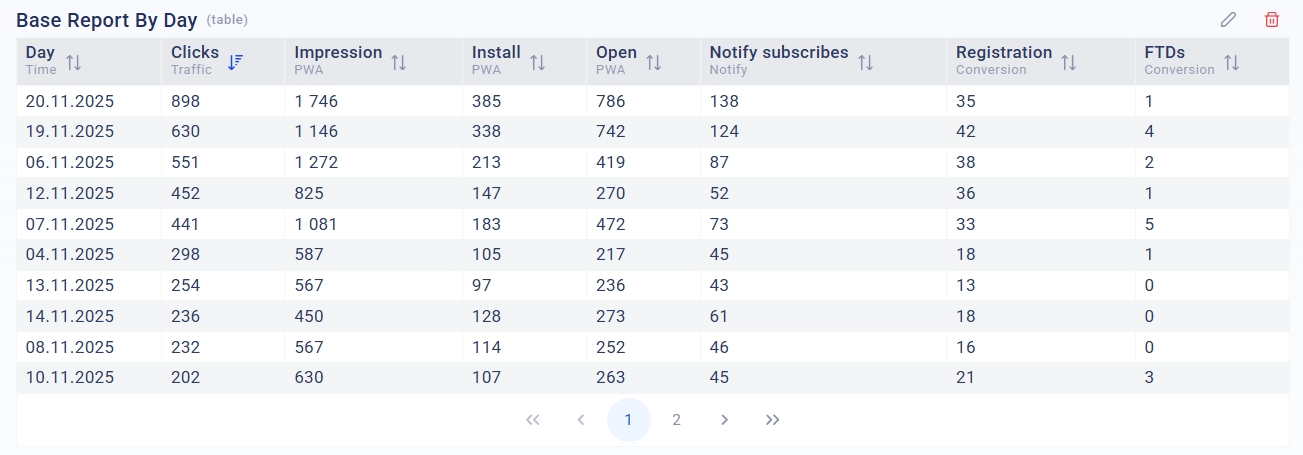
Displays report data in tabular form
Supports pagination
Columns are formatted according to metric types
Line Chart
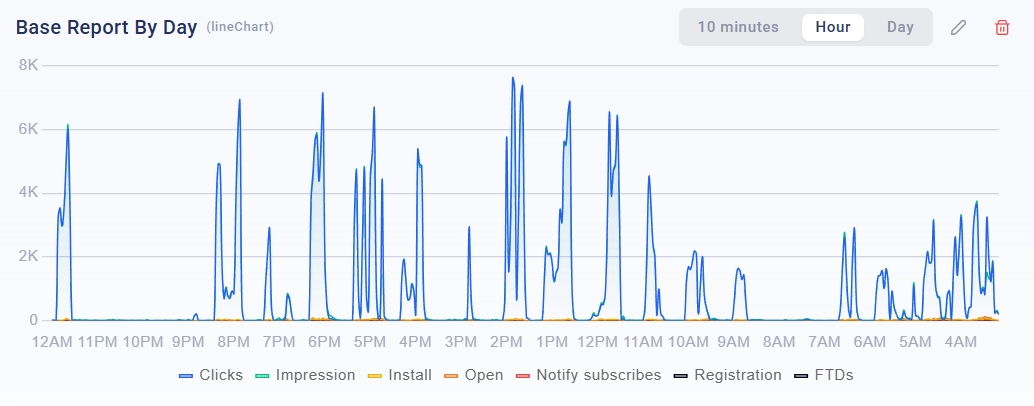
Visualizes metrics over time
Granularity switch: 10 min / Hour / Day
Supports multiple metrics simultaneously
Metrics Cards

Compact display of key indicators
Shows the value of each metric for 14 days, today, yesterday, and 7 days
3.3 Editing a Widget
In edit mode, each widget displays buttons:
Pencil — edit widget settings
Trash can — delete widget
3.4 Moving Widgets (Drag & Drop)
Enter edit mode
Hold the widget with the left mouse button
Drag it to a new location
Blue preview shows where the widget will be placed
Release the mouse button
Features:
Widgets automatically shift down in case of collisions
Widgets pull up to fill empty spaces
You cannot place a widget on top of another
3.5 Resizing a Widget
Enter edit mode
Hover over the bottom right corner of the widget
A resize icon will appear
Hold and drag to resize
Green preview shows the new size (e.g., "6 x 3")
Limitations:
Minimum size: 1 column × 1 row
Maximum width: 12 columns (screen width)
Height: no limits
Section 4: Setting the Period and Time Zone
4.1 Selecting a Period
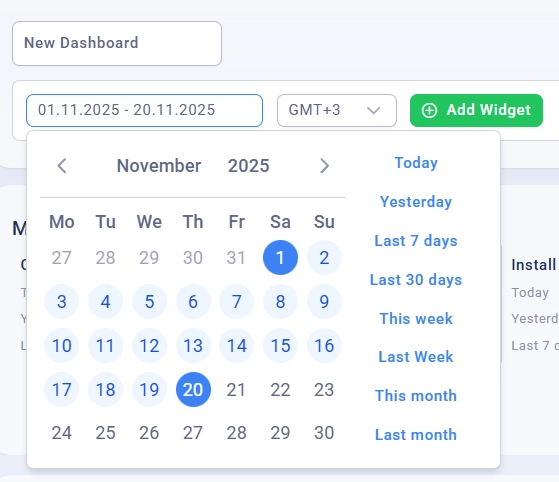
Click on the date field to select a period:
Calendar — select start and end dates
Presets — quick selection of popular periods:
Today / Yesterday
Last 7 days / Last 30 days
This week / Last week
This month / Last month
4.2 Setting the Time Zone
Select a time zone for correct data display. By default, the time zone from user settings is used.
4.3 Refreshing Data
Click the refresh button (circular arrows icon) to force refresh data in all widgets.
Section 5: Requirements for Saved Reports
5.1 Creating a Report for a Widget
Dashboard widgets operate based on saved reports. Before adding a widget, you need to:
Go to the Reports section
Set up a report with the necessary metrics and groupings
Save the report
5.2 Report Recommendations
Widget Type | Recommended Report Settings |
|---|---|
Table | Any groupings and metrics |
Line Chart | Time grouping (Day/Hour), numeric metrics |
Metrics Cards | Only metrics without groupings |
Section 6: Practical Examples
Example 1: Dashboard for a Buyer
Task: Create a dashboard to monitor your campaigns.
Setup:
Create a report grouped by campaigns with metrics: Clicks, Installs, Accept, Revenue
Create a new dashboard "My Campaigns"
Add widgets:
Metrics Cards (12×1) — overall statistics
Line Chart (8×3) — dynamics by days
Table (12×4) — details by campaigns
Set as the default dashboard
Example 2: Overview Dashboard for a Team Lead
Task: See the results of the entire team.
Setup:
Create reports:
By users (grouping: User, metrics: all)
By sources (grouping: Team + Source, metrics: all)
Create a dashboard "Team Overview"
Add widgets in 2 columns:
Top Users Table (6×4) — left column
Top Sources Table (6×4) — right column
Team Line Chart (12×3) — full width at the bottom
Section 7: Tips and Best Practices
7.1 Performance Optimization
✅ Limit the number of rows in tables (10-20)
✅ Use appropriate granularity for charts
❌ Avoid too many widgets (more than 10)
7.2 Organizing Widgets
Place important metrics at the top
Group related widgets nearby
Use the full width (12 columns) for overview charts
7.3 Working with Reports
Create separate reports for different widgets
Give reports clear names
Periodically check the relevance of reports
Section 8: Frequently Asked Questions (FAQ)
Q: Why don't I see the "Add Widget" button?
A: The button only appears in edit mode. Click "Edit" to enter this mode.
Q: Can the system dashboard be edited?
A: No, the system dashboard is view-only. Create your own dashboard for customization.
Q: Why does the widget show "No report selected"?
A: The report on which the widget is based has been deleted. Edit the widget and select another report.
Q: How to restore the system dashboard after deletion?
A: The system dashboard cannot be deleted. Select it from the list of dashboards.
Q: Why is the data not updating?
A: Click the refresh button or change the period. Also, check the time zone settings.
Q: Can I share the dashboard with other users?
A: In the current version, dashboards are personal. Each user creates their own dashboards.
Q: How many dashboards can be created?
A: There is no limit, but it is recommended to create no more than 5-7 for convenience.
Q: What happens when a report used in a widget is deleted?
A: The widget will show a message about the missing report. Edit the widget and select another report.