
Widget: Period comparison
The Period comparison widget shows every metric of a report against the previous period: the current value, the previous value and the change.
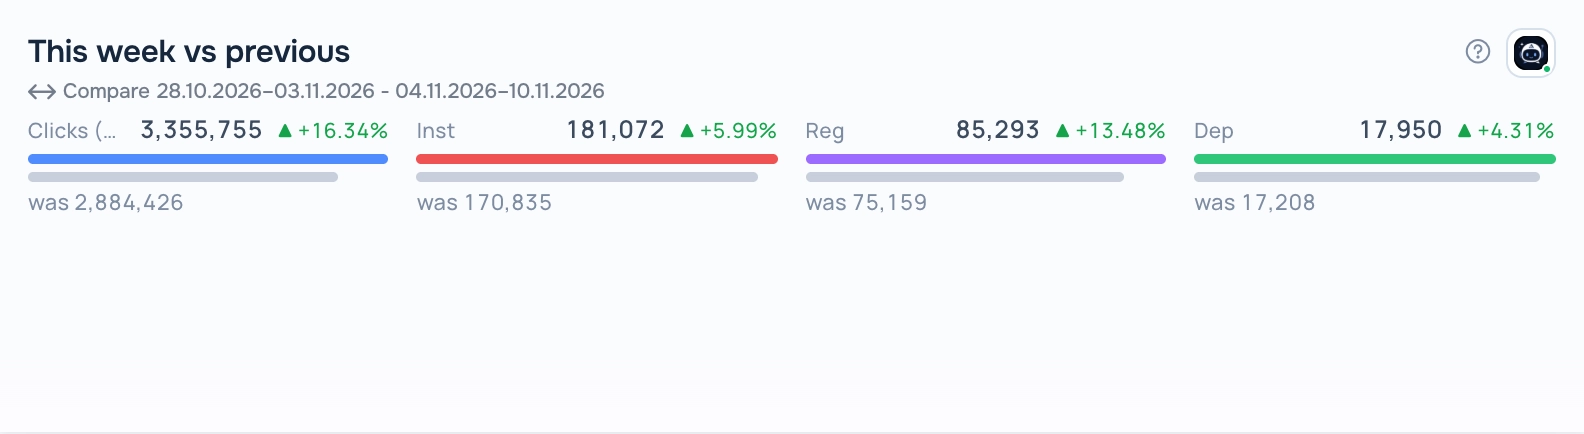
Period comparison widget
What the report needs
A saved report with at least one metric and period comparison turned on in the report builder. The widget takes the comparison type (previous period or the same period earlier) from the report.
Views
The widget has several views. Switch the view in the widget header while the dashboard is in edit mode; the choice is saved with the dashboard.
Bars
Two bars per metric — the current and the previous period — with the change in percent.
Deviation
The change of each metric from the previous period on one scale: growth to the right, decline to the left.
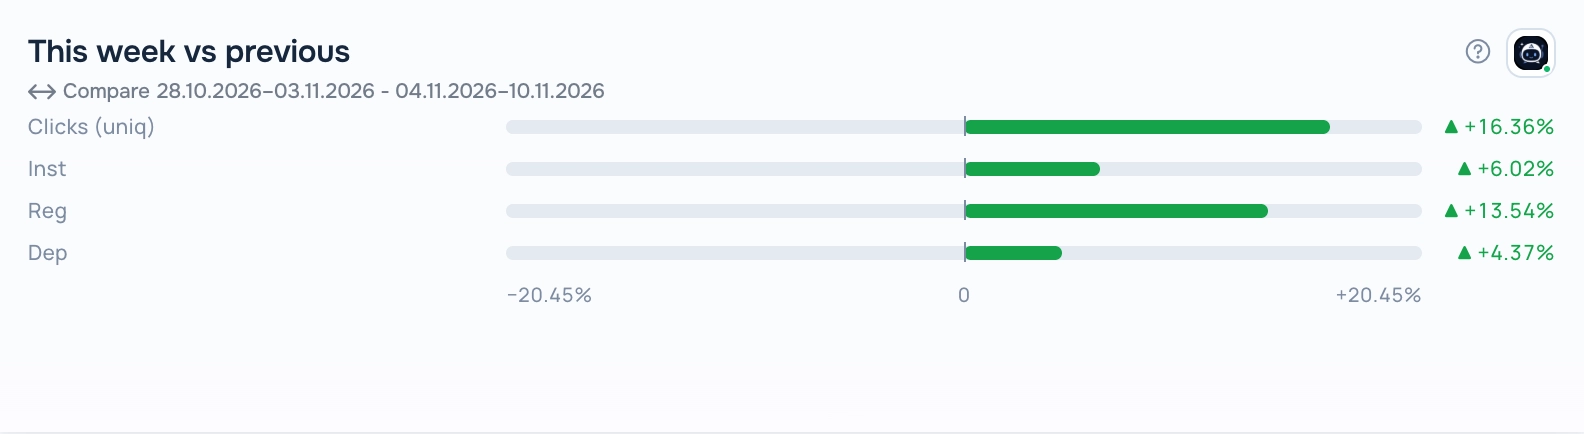
Period comparison — Deviation view
Cards
A card per metric with the change and a cumulative line of both periods.
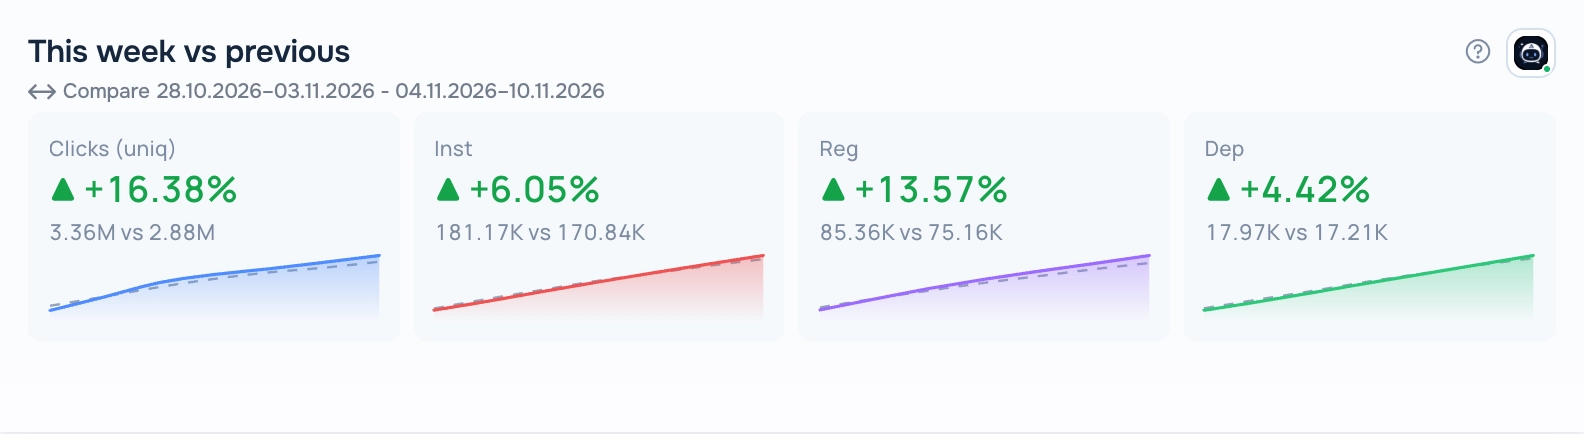
Period comparison — Cards view
How to add the widget
- Open Tracker → Dashboard, open the dashboard list and click the pencil icon next to your dashboard to enter edit mode.
- Click Add Widget and choose Period comparison in Display type.
- Pick a report in Select saved report. The list shows only reports that fit this display type. If it is empty, create a report in Tracker → Reports first.
- Set the optional title, width and height, then click Save.
- Click Save on the dashboard toolbar to keep the changes.
Period
The widget shows data for the period saved in its report; the caption under the title shows the dates. When you change the dates in the dashboard date selector, all widgets switch to the dashboard period.
Tips
- The caption under the title shows both periods: the previous one first, then the current one.
- If you turn comparison off in the report, the widget shows a message that the report no longer fits this display type.
The ? button in the widget header opens this help article. The Adset AI button next to it opens the assistant with the widget context and ready-made questions about its data.