
Widget: Scatter plot
The Scatter plot widget places the positions of a breakdown on two axes, so you can see which ones have volume and which ones convert.
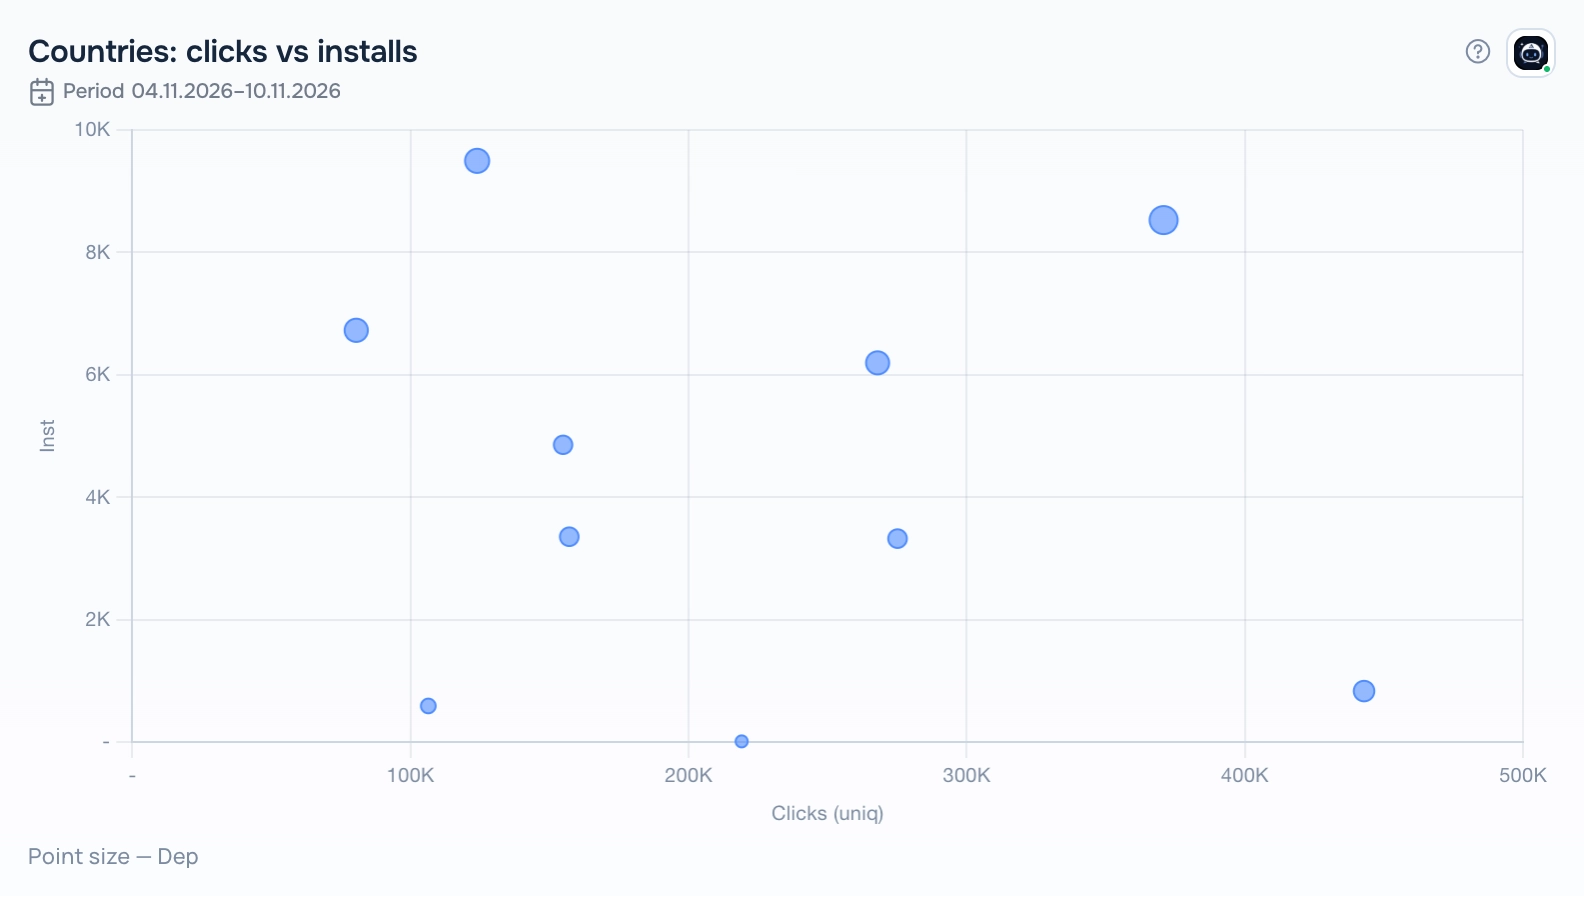
Scatter plot widget
What the report needs
A saved report with exactly one non-time grouping and at least two metrics. The first metric is the X axis, the second one is the Y axis, the optional third one sets the size of a point.
Views
Scatter
A point per position. Points in the upper right corner are strong on both metrics.
How to add the widget
- Open Tracker → Dashboard, open the dashboard list and click the pencil icon next to your dashboard to enter edit mode.
- Click Add Widget and choose Scatter plot in Display type.
- Pick a report in Select saved report. The list shows only reports that fit this display type. If it is empty, create a report in Tracker → Reports first.
- Set the optional title, width and height and the rows limit, then click Save.
- Click Save on the dashboard toolbar to keep the changes.
Settings
- Rows limit — how many positions to show.
Period
The widget shows data for the period saved in its report; the caption under the title shows the dates. When you change the dates in the dashboard date selector, all widgets switch to the dashboard period.
Tips
- Hover over a point to see the position and its values.
- Positions far from the others are the first candidates to scale or to check.
The ? button in the widget header opens this help article. The Adset AI button next to it opens the assistant with the widget context and ready-made questions about its data.