
Widget: Share map
The Share map widget shows the positions of a breakdown as rectangles: the area is the share of the first metric, the color is the value of the second metric.
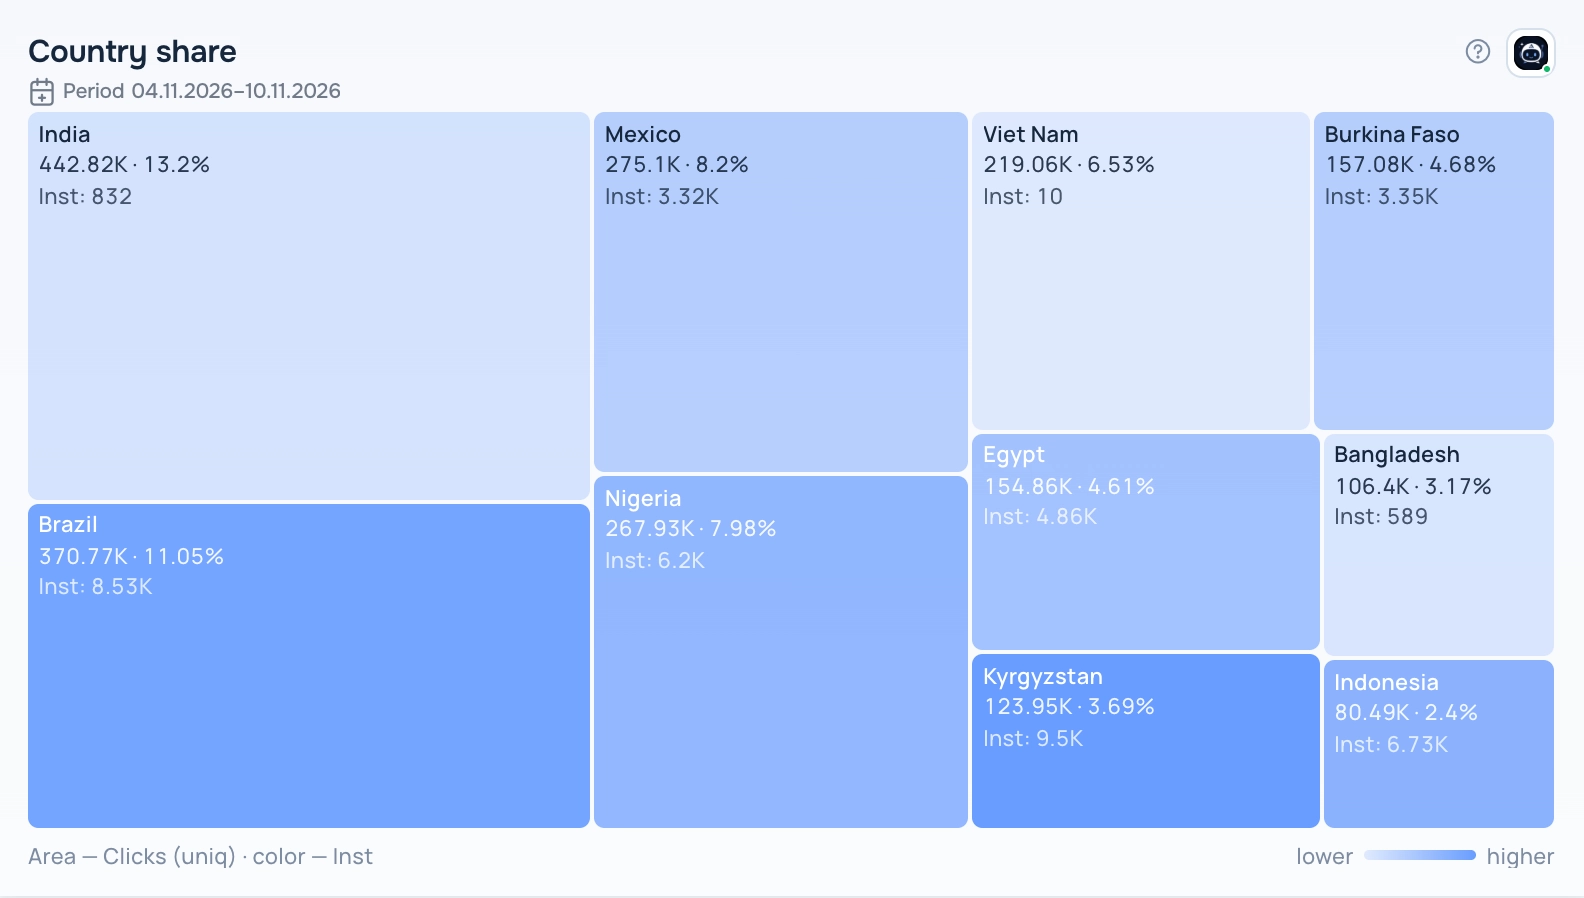
Share map widget
What the report needs
A saved report with exactly one non-time grouping and at least two metrics. The first metric sets the area, the second one sets the color.
Views
Treemap
Rectangles sized by the first metric and colored by the second one, with a color scale under the map.
How to add the widget
- Open Tracker → Dashboard, open the dashboard list and click the pencil icon next to your dashboard to enter edit mode.
- Click Add Widget and choose Share map in Display type.
- Pick a report in Select saved report. The list shows only reports that fit this display type. If it is empty, create a report in Tracker → Reports first.
- Set the optional title, width and height and the rows limit, then click Save.
- Click Save on the dashboard toolbar to keep the changes.
Settings
- Rows limit — how many positions to show.
Period
The widget shows data for the period saved in its report; the caption under the title shows the dates. When you change the dates in the dashboard date selector, all widgets switch to the dashboard period.
Tips
- A typical pair: volume as the first metric (clicks) and quality as the second one (a conversion rate).
- Hover over a rectangle to see the exact values.
The ? button in the widget header opens this help article. The Adset AI button next to it opens the assistant with the widget context and ready-made questions about its data.