
Creative Library
Creative Library collects all images and videos from your ads into one gallery and shows how much each creative has earned — regardless of which campaigns and accounts it has been running in. This answers the question of “which creative to run next,” which is manually compiled from ad tables.
Screen: menu Meta / TikTok → Creative Library (/ads/creative-library).
How the library is filled
There is no separate upload — creatives arrive automatically:
ad synchronization sees the creative and downloads its preview;
then the system retrieves the original — the full-size image or video file;
the file is saved once: identical creatives are merged by content. The same banner in ten ads is one line in the library with total metrics.
Important limitations:
Only Facebook. TikTok does not provide media files of ads through the API, so TikTok creatives do not make it to the library.
It takes time. After connecting the profile, creatives will not appear immediately: first, the structure is synchronized, then the media is downloaded.
The empty state states: “Creatives appear after the ad sync downloads the media.”
Library table
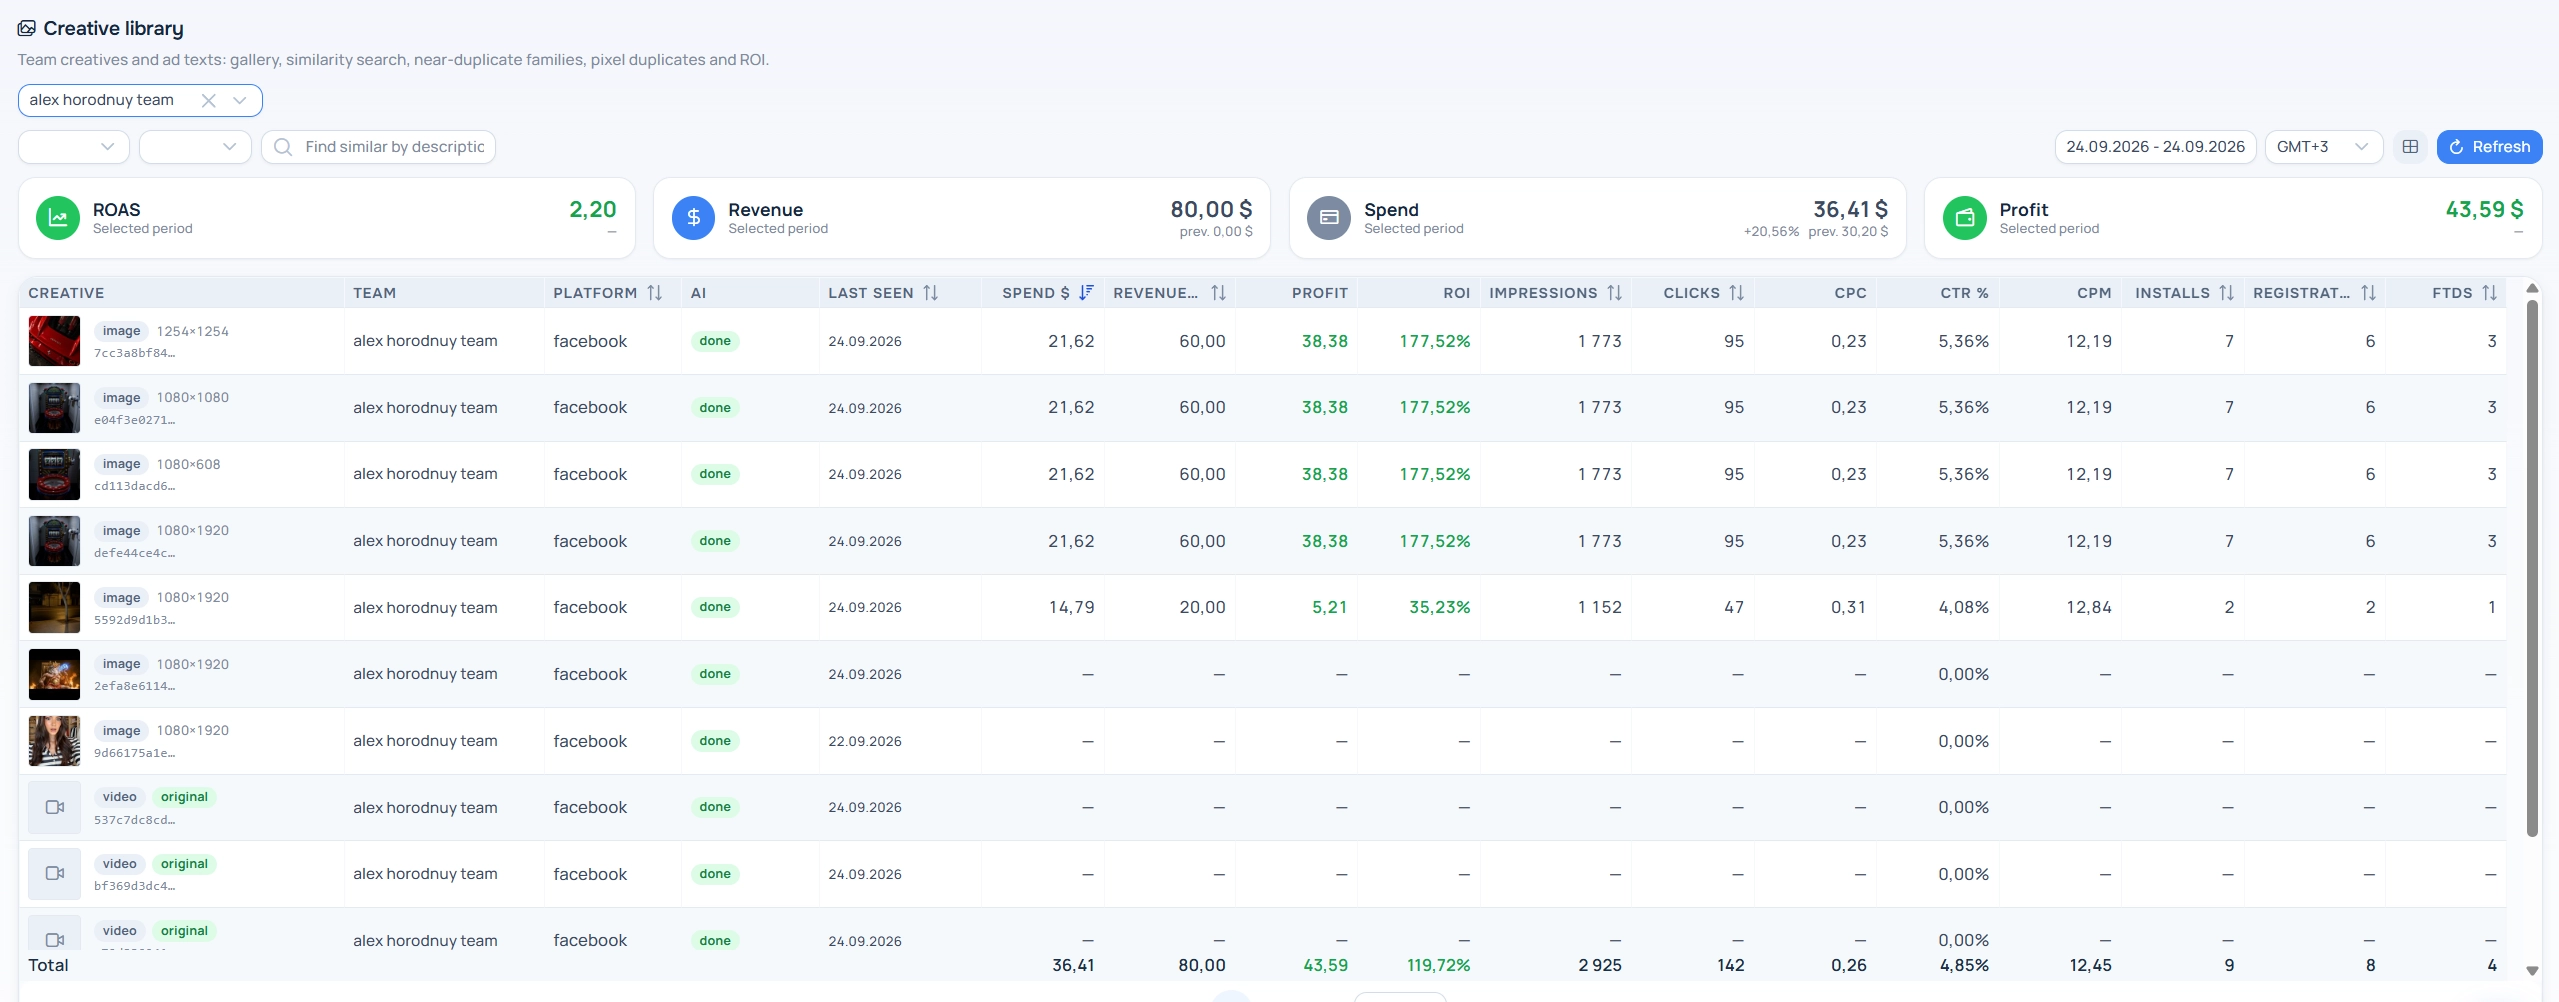
Each row is one creative. Basic columns:
Column | What it shows |
|---|---|
Creative | Preview, format tag (image or video), “original” mark, dimensions in pixels |
Platform | Source of the creative |
AI | Status of automatic parsing of the creative (text recognition and description) |
Last shown | When the creative was last seen in ads |
Ads | In how many ads it is used |
Plus metrics for the selected period: Spend $, Revenue $, Profit, ROI, Impressions, Clicks, CPC, CTR %, CPM, Installs, Registrations, FTD and funnel ratios (Click 2 Install / Registration / FTD, Install 2 Registration / FTD, Registration 2 FTD). Default sorting is by spend. Default period is today, don’t forget to extend it.
Filters: format (all / images / videos), platform, period and timezone; for the platform administrator — team selection. Above the table — ROAS / Revenue / Spend / Profit cards with changes from the previous period and, if necessary, a warning about partial attribution.
How to read the numbers
Conversions and revenue are exact, not estimates: they are tied to specific ads via the ad ID from the source. If mapping is not set up, the columns will be empty — see “Setting up traffic sources for correct mapping”.
Profit and ROI are shown only when tracker data is available. A dash means “no conversions for calculation,” not “ROI is zero.” ROI above 30% is highlighted in green, from 0 to 30% — in orange, negative — in red.
The total row is not the sum of the column. Ad metrics are assigned to each creative as a whole, so when summing rows, an ad with two creatives would be counted twice. The total is calculated based on unique ads in the sample — this is the correct number, but it will not match the sum in the column.
Finding similar creatives
The search field in the toolbar works not as a text filter by name, but as a semantic search: describe the creative in words (“girl with a smartphone, roulette, big win”) and press Enter — the system will find visually similar creatives. Results are displayed in tiles, each tile has a degree of similarity.
This feature relies on automatic parsing of creatives. If it is not set up on your site, the search and similar block will be unavailable — the rest of the library works as usual.
Creative card
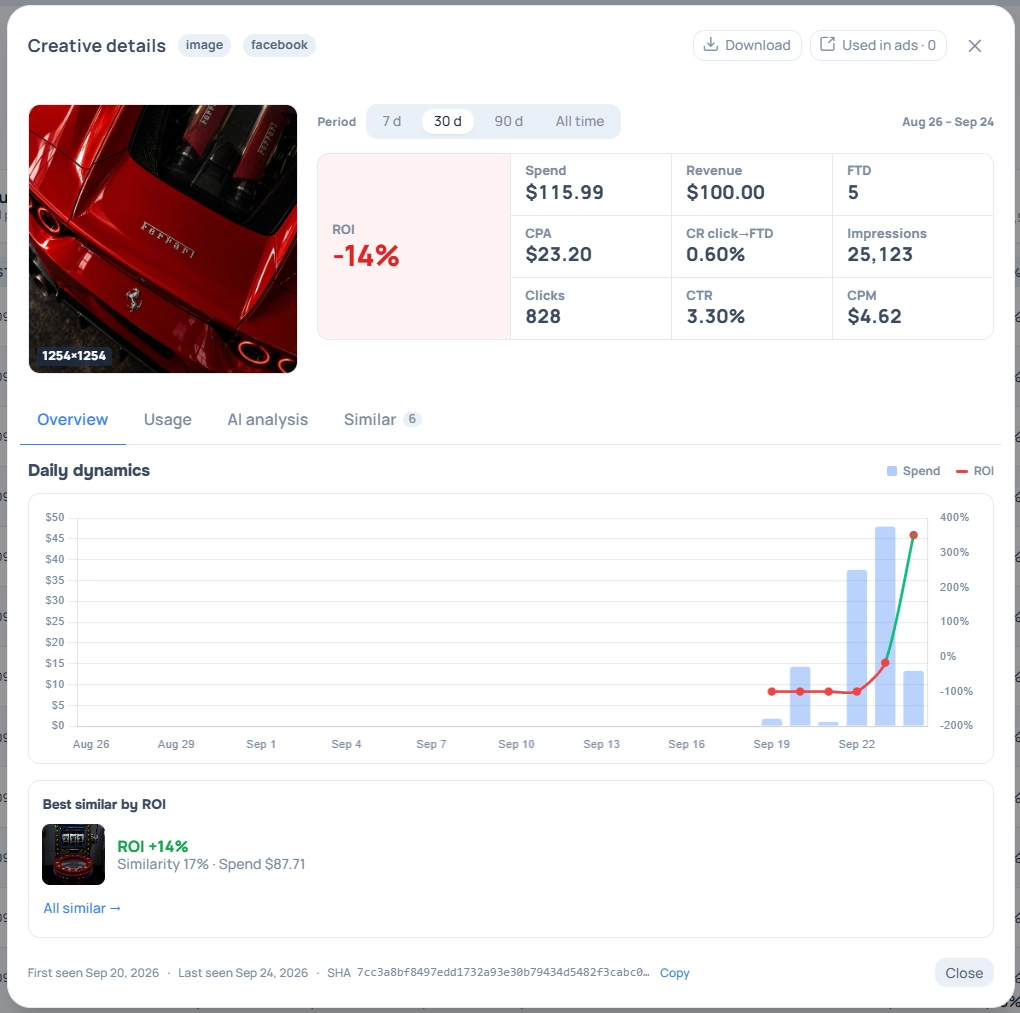
Clicking on a row opens the card — the main analysis tool. In the header, format and platform tags, the “Download” button (exports the original) and a button to go to the ads where the creative is used.
The period inside the card switches separately: 7 days / 30 days / 90 days / All time (default is 30). “All time” is counted from the first showing of the creative, but no deeper than 185 days — when truncated, a corresponding note appears.
KPI block: ROI in large, next to Spend, Revenue, FTD, CPA, conversion “click → FTD”, Impressions, Clicks, CTR, CPM.
Tab | What’s inside |
|---|---|
Overview | Chart “Dynamics by days”: columns — spend, line — ROI. The moment of creative burnout is visible. Below — the best similar creative by ROI |
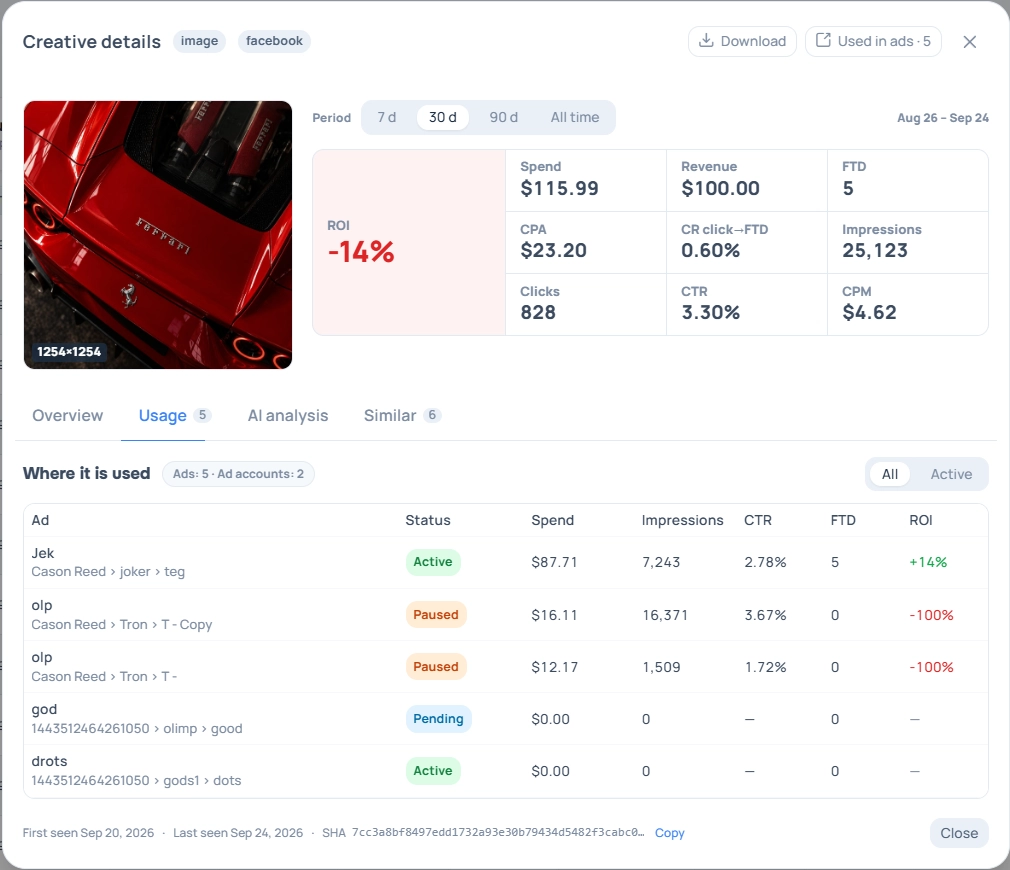
Usage | Where the creative is running: ad with the path “Account › Campaign › Adset”, status, spend, impressions, CTR, FTD, ROI. Filter “All / Active” and a counter of ads and accounts |
AI Analysis | Text recognized on the creative, automatic image description and transcript for video. If parsing has not yet occurred, it is stated so |
Similar | Similar creatives sorted by ROI or similarity, “duplicate” mark for the same file in another size or format, and “family of almost duplicates” with summary spend and ROI across the family |
In the footer of the card — dates of the first and last showing and the technical file identifier with a copy button.
How to use it
Find working combinations. Sort by spend over 30 days and look at ROI: creatives with high spend and ROI above 30% are worth scaling.
Catch burnout. On the “Overview” tab, a falling ROI line with maintained spend means it’s time to change the creative.
Do not relaunch unsuccessful ones. Before launching an old creative, open its card: the library remembers the entire history, even if the ads have long been deleted.
Search for replacements. The “Similar” tab sorted by ROI shows which of the visually close creatives works better.
Understand where the creative is still running. The “Usage” tab with the “Active” filter is a quick way to stop a losing creative across all campaigns at once.
What is not in the library
To avoid unnecessary searching:
Your own tags and collections — creatives cannot be tagged or grouped into collections.
Structured characteristics (offer, character, geo, style) — automatic parsing gives recognized text, description, and transcript, but not attributes broken down into fields.
Separate screen for ad texts — texts are collected, but they do not have their own gallery.
Uploading a sample creative for image search — search works by text description.
TikTok creatives — see limitations above.
Access rights
The library is available to all roles. The creatives themselves are visible within the team — the file is deduplicated at the team level, so the buyer sees the creatives that appeared with colleagues. Metrics are counted within your data visibility: the buyer sees spend and revenue only for their ads. The platform administrator selects the team in the switcher.
Frequently asked questions
Creatives are missing, although ads are in the tables
Downloading media is a separate step after synchronizing the structure — wait for the next cycles. If the profile is connected via a plugin, an open logged-in Facebook tab is required to download originals. There will be no creatives for TikTok at all.
There is spend, but revenue and ROI are empty
Conversions are not tied to the ads. Check that the ad ID macro is mapped in the source, and look at the warning about partial attribution above the table.
Why is the sum of the spend by rows greater than the total spend?
Because an ad can have multiple creatives, and the ad metrics are attributed to each of them as a whole. To reconcile with the total spend, look at the total row or KPI cards — they are calculated based on unique ads.
One creative is shown in two rows
This means the files differ by bytes — for example, the same banner has been resaved in a different size or format. In the card, such creatives are linked with the “duplicate” mark and combined into a “family of almost duplicates” with summary metrics.
What does the status in the “AI” column mean?
This is the state of automatic parsing: text recognition on the image and content description. Until parsing has occurred, the “AI Analysis” tab in the card is empty. This does not affect metrics, spend, and ROI.