
Web Push Analytics (Post-Click Attribution)
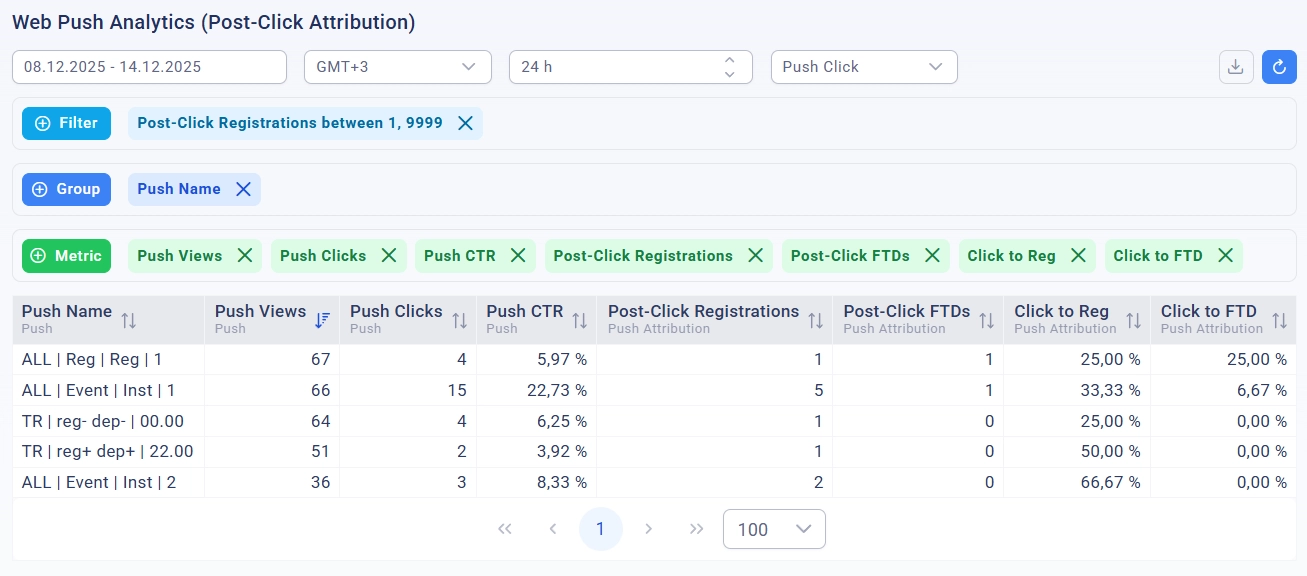
The Web Push Analytics section provides a powerful tool for analyzing the effectiveness of push notifications with post-click attribution. This section allows tracking not only direct metrics of push notifications (views, clicks) but also conversions that occurred within a certain time after the user's interaction with the notification.
Location: Menu "Notifications" → "Analytics"
Main Features
1. Setting the Analysis Period
Date Range Selection
-
Method 1: Manual date entry in the format dd.mm.yy
-
Method 2: Using the calendar to select the start and end date
-
Method 3: Quick presets:
-
Today - current day
-
Yesterday - previous day
-
Last 7 days - last week
-
Last 30 days - last month
-
This week - from Monday of the current week
-
Last week - from Monday to Sunday of the previous week
-
This month - from the 1st of the current month
-
Last month - the entire previous month
-
Time Zone Selection
Allows analyzing data in the desired time zone. By default, the user's time zone is used.
2. Attribution Settings
Attribution Window
Defines the time interval after interaction with the push notification during which conversions will be considered related to this notification.
Parameters:
-
Minimum: 1 hour
-
Maximum: 720 hours (30 days)
-
Default: 24 hours
-
Step: 1 hour
Example: If a 24-hour window is set, the system will track all conversions (registrations, deposits) that occurred within 24 hours after clicking on the push notification.
Event Type for Attribution
Defines which interaction with the push notification is considered the starting point for attribution:
-
Click on Push (recommended) - the count starts from the moment of clicking on the notification
-
Push Display - the count starts from the moment the notification is displayed to the user
3. Filters
The filters section allows segmenting data by various dimensions.
4. Groupings
Groupings define by which dimensions the data will be grouped in the report.
5. Metrics
Metrics are the numerical indicators you want to analyze.
6. Results Table
After setting the parameters and clicking the "Refresh" button (refresh icon), a table with results will be displayed.
Table Features:
Sorting:
-
Click on the column header to sort
-
Re-click changes the sorting direction (ascending/descending)
Pagination:
-
Select the number of rows per page: 50, 100, 250, 1000
-
Page navigation: "Previous" / "Next" buttons
-
Display of the total number of records
Column Resizing:
-
Hover the cursor over the border between columns
-
Drag to change the width
Data Formatting:
-
Time fields are displayed in the selected format (day, hour, week, month)
-
Metrics are formatted according to their type:
-
Integers - without decimal places
-
Percentages - with the symbol "%"
-
Ratios - with 2 decimal places
-
Usage Examples
Example 1: Analyzing the Effectiveness of a Push Campaign for the Last Month
Task: Determine which push notifications led to the highest number of conversions over the last 30 days.
Settings:
-
Period: Select the preset "Last 30 days"
-
Time Zone: UTC (or yours)
-
Attribution Window: 24 hours
-
Event Type: Click on Push
-
Groupings:
-
Push Name
-
Day
-
-
Metrics:
-
Views
-
Clicks
-
CTR
-
Registrations
-
FTD
-
Click to FTD
-
Result:
The table will show for each push notification by days all key metrics and conversions.
Example 2: Analyzing Conversions by Countries
Task: Identify countries with the best conversion from click to deposit.
Settings:
-
Period: Select the preset "This month"
-
Attribution Window: 48 hours (2 days)
-
Groupings: user_country (Country)
-
Metrics:
-
push_clicks (Clicks)
-
push_postclick_accepts (Accepts)
-
push_click_to_accept_rate (Conversion)
-
-
Filter:
- push_clicks BETWEEN 100 and 999999 (minimum 100 clicks for statistical significance)
Result:
A list of countries sorted by conversion, with a minimum threshold of clicks.